Observability: What is it and how do we get there?

Observability is a commonly used buzzword in the IT industry these days. Many companies use this term to sell their products and solutions to their customers. Though this idea could be a great selling point to many IT companies who are looking to modernize their infrastructure, it would be a challenge for these companies if they are unfamiliar with the true meaning of observability and how it will benefit their businesses moving forward.
So, what is observability? How did we get here from just the simple “monitoring”?
Observability is a distributed system’s capability to have its internal state be defined, derived, and understood based on an external source of data. This means that an observable system, such as a complex service provider network, is one that can have its status defined and understood by operators, senior management, and even customers at any given time based on the output data provided by external tools.
The more observable a network is, the quicker and more accurate one can arrive at the root cause of an existing issue.
With monitoring, the operators gather and rely on a set of data from multiple tools and provide reactive resolution. But with observability, the tools are just components that play a part in deriving the state of a system. The key here is the operators and how they can combine the output data and proactively provide the current state of a system.

For a complex, distributed system to be observable, these three pillars are key: logs, metrics, and traces. These three pillars are as important as the other and we cannot consider observability without one of all three.
3 Observability Pillars
1. LOGS
Logs are timestamped records of events that happened within the network.
Logs tell you discreetly what happened and when it happened. They provide detailed information about an event and are often presented in plaintext.
Logs are easy to generate, and most infrastructure components can provide logs that can be gathered and stored on a server or over the cloud. They are also straightforward in terms of the information it provides. The challenge for logs as a standalone set of data is that it does not provide you the high-level visibility of the network and that due to the amount of information that is contained in each log, indexing can be quite difficult.
2. METRICS
Metrics are the representations of various numerical data gathered from multiple components within the network.
With metrics, operational health, and performance data can be gathered from multiple sources and could be used as key performance indicators (KPI) of a network’s behavior. These data can be presented graphically to help in the mathematical and predictive analysis of the network’s behavior. Trends can be seen just from the metrics and alerts can be set whenever certain data exceeds or goes lower than a set threshold. Furthermore, dashboards can be customized for metrics in a way that one can view the overall stats within the network, and then dive deeper into a particular data.
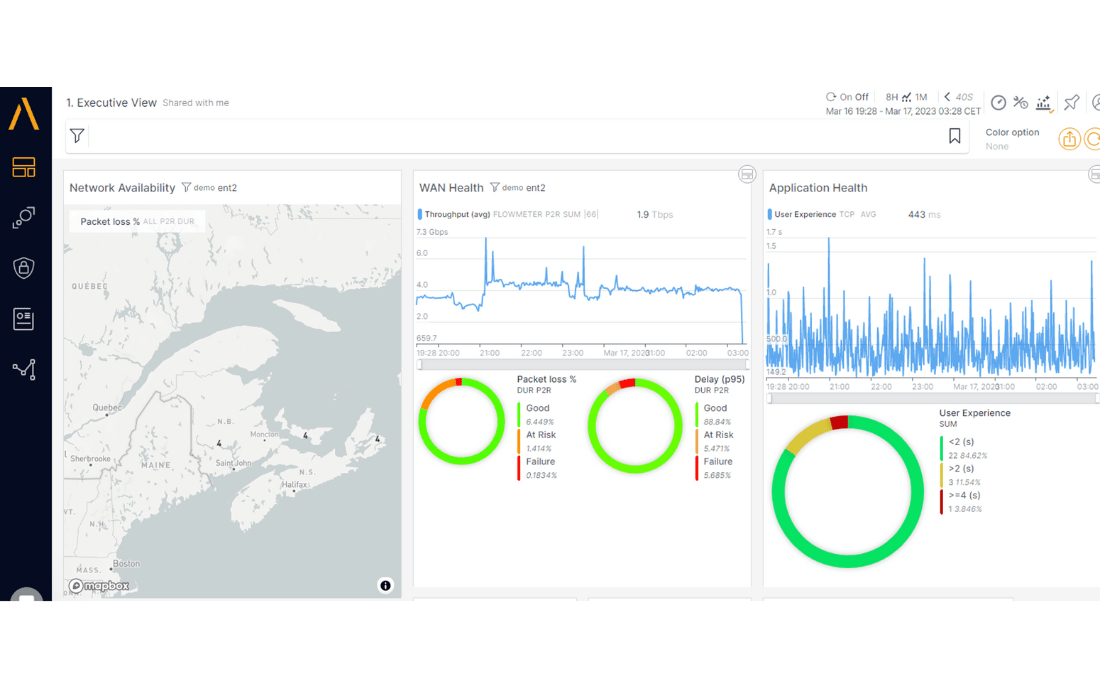
Below is a sample dashboard from Accedian wherein several metrics are presented. With this, one can see the overall network health but can also navigate between other dashboards in each section to see more details of the network. For operators, this would help them in faster issue resolution.
3. TRACES
Traces can present the complete end-to-end path of a flow as it traverses throughout the network. With traces, an operator can pinpoint where an issue is happening.
In a complex, distributed system like that of a service provider, the ability to pinpoint where each traffic is coming from is critical to obtain valuable insight into a network. Having visibility of the entire paths of a flow is not just useful in debugging or troubleshooting, but it can also help prepare for capacity planning.
How Can Businesses Transition To An Observable Network?
Now that we have defined what are the three pillars, how then do we make the transition of a system to becoming an observable system? Do we have to make huge changes in the infrastructure and tools?
- First, assess what you have in your network and infrastructure. Provide an assessment of the applications and services that run within the network. What are the services and applications that run? How much is the amount of usage and traffic for each application and service? Also, consider the devices and types of traffic, and protocols that the network uses. Finally, consider the customer experience. Beyond what is happening in the backend, it’s the end customer who can provide valuable insight as to how a network is performing.
- Second, select the tools to retain and tools to add to cover the observability pillars.
Many companies these days have multiple tools, some are open-source and others are paid with premium prices. However, not all these tools are being used or provide value. Some are just redundant and others are dormant and not even be accessed by the operations team.
Data from tools can and should also be correlated.
It’s difficult to provide insight if the data provided by different tools is data that is standalone and does not provide correlation with other tools.
When selecting the tools to be used in the observability roadmap, make sure that all these tools cover the three pillars. It can be as simple as just three tools. Overall, limit the number of tools to only the important and valuable ones to avoid tool sprawl.
- The third is to organize a committee.
A business cannot take the road toward observability singlehandedly. This is why organizing a committee is critical. This committee must consist of multiple personnel that come from various teams who represent and take the lead for each of their respective teams in the company’s road to observability.
It is important to have insights from various groups, from the higher-level architecture team to the low-level engineering and operations team to even the change management team. These people should have a clear understanding of the concept and importance of observability as they will serve as the primary driving force.

- Lastly, integrate the tools with each other and with the entire network.
So, the network has been assessed, the tools have been selected and the committee has been organized. This is where everything that came in the first three steps will be brought together.
The tools selected will be installed and integrated, first with a lab environment for POC and then for the entire network. This is where the importance of the correlatability of the output data from each tool comes in. As each tool will also be integrated with the other, it is also very critical that the output data can be correlated with each of the tools themselves.
When and where automation is possible, apply and implement it to make the entire observability stack work seamlessly. The committee will be involved and oversee the entire integration process and will also be the one to relay the knowledge of observability to their teams, not just for better understanding, but to also train and have that mindset of obtaining insight from an observable network.
Moving from just passive monitoring to having an observable network with actionable insights may not be as easy as it sounds, especially if there is a lack of skilled personnel internally. But there is also the possibility of a third-party consultancy comprising experienced professionals in this field. This will surely give the entire company a big boost, from operations to executives up to the end users. Customer experience will be transformed for the better as the operations team will spend less time in troubleshooting and diagnosing the issue. Engineering and architecture teams will be able to proactively prevent future problems within the network. And the senior executive team will have a better, high-level understanding of the network performance. All these goods can come just because the entire network is observable.


